
ESP8266 DHT11 Weather Monitor with OLED and Google Gauge
- Ramesh G

- Sep 30, 2022
- 6 min read

In this project, how to make a weather monitor using an ESP8266, DHT11 and OLED display. The Temperature , humidity data to UI oled display and Google chart Gauge for visualization.
The Google Charts provides a perfect way to visualize data on html page. The most common way to use Google Charts is with simple JavaScript that you embed in html page. You load some Google Chart libraries, list the data to be charted, select options to customize your chart, and finally create a chart object with an id that you choose. Then, later in the web page, you create a <div> with that id to display the Google Chart.
Circuit Diagram

Components Required
0.96 OLED 4wire Module - 1no
Node MCU ESP8266 12E Dev Module- 1 no
DHT11 - 1 no
Jumper wires


DHT 11/22/AM2302
Connecting DHT11/DHT22/AM2302 sensor to ESP8266 NodeMCU is fairly simple.
Connect VCC pin on the sensor to the 3.3V pin on the NodeMCU and ground to ground. Also connect Data pin on the sensor to D5 pin of the ESP8266 NodeMCU.
Installing the library
To install the library navigate to the Sketch > Include Library > Manage Libraries… Wait for Library Manager to download libraries index and update list of installed libraries.
Download SSD1306_Library , we need to use this library for SSD1306 OLED display
Download DHT Library , we need to use this library for Temperature sensor.
In your Arduino IDE, to install the libraries go to Sketch > Include Library > Add .ZIP library… and select the library you’ve just downloaded.
After installing the required libraries, copy the following code to your Arduino IDE
arduino code
#include <ArduinoJson.h>
#include <ESP8266WiFi.h>
#include <WiFiClient.h>
#include <ESP8266WebServer.h>
#include <Wire.h>
#include <Arduino.h>
#include "user_interface.h"
#include <SSD1306Wire.h>
#include <OLEDDisplayUi.h>
#include "icons.h"
#include "fonts.h"
#define GAUGE_REFRESH 1000 // How oftern (in milliseconds) to refresh the gauge values
#include "DHT.h"
#define DHTPIN 14 // Digital pin connected to the DHT sensor
// Feather HUZZAH ESP8266 note: use pins 3, 4, 5, 12, 13 or 14 --
// Pin 15 can work but DHT must be disconnected during program upload.
#define DHTTYPE DHT11 // DHT 11
//#define DHTTYPE DHT22 // DHT 22 (AM2302), AM2321
//#define DHTTYPE DHT21 // DHT 21 (AM2301)
DHT dht(DHTPIN, DHTTYPE);
String t,f,h;
//WiFi Connection configuration
const char* ssid = "TP-Link_3200"; //YOUR SSID
const char* password = "95001121379884265554"; //YOUR PASSWORD
WiFiServer server(80);
// Setup
const int UPDATE_INTERVAL_SECS = 1 * 60; // Update every 1 minutes
// Display Settings
const int I2C_DISPLAY_ADDRESS = 0x3C;
const int SDA_PIN = D2;
const int SDC_PIN = D1;
SSD1306Wire display(I2C_DISPLAY_ADDRESS, SDA_PIN, SDC_PIN);
OLEDDisplayUi ui ( &display );
bool readyForUpdate = false;
void updateData(OLEDDisplay *display) {
drawProgress(display, 50, "Updating Time...");
// worldClockClient.updateTime();
drawProgress(display, 100, "Done...");
readyForUpdate = false;
delay(1000);
}
void drawProgress(OLEDDisplay *display, int percentage, String label) {
display->clear();
display->setTextAlignment(TEXT_ALIGN_CENTER);
display->setFont(ArialMT_Plain_10);
display->drawString(64, 10, label);
display->drawProgressBar(10, 28, 108, 12, percentage);
display->display();
}
void drawFrame1(OLEDDisplay *display, OLEDDisplayUiState* state, int16_t x, int16_t y) {
display->clear();
display->setFont(ArialMT_Plain_24);
display->setTextAlignment(TEXT_ALIGN_LEFT);
float t = dht.readTemperature();
display->drawString(0, 0,"ESP8266 ");
display->drawString(0, 26,"SERVER");
delay(1000);
}
void drawFrame2(OLEDDisplay *display, OLEDDisplayUiState* state, int16_t x, int16_t y) {
display->clear();
display->setFont(ArialMT_Plain_24);
display->setTextAlignment(TEXT_ALIGN_LEFT);
float t = dht.readTemperature();
display->drawString(0, 0,"Celsius");
display->drawString(0, 26, String(t)+"°C");
delay(1000);
}
void drawFrame3(OLEDDisplay *display, OLEDDisplayUiState* state, int16_t x, int16_t y) {
display->clear();
display->setFont(ArialMT_Plain_24);
display->setTextAlignment(TEXT_ALIGN_LEFT);
float f = dht.readTemperature(true);
display->drawString(0, 0,"Fahrenheit");
display->drawString(0, 26, String(f)+"°F");
delay(1000);
}
void drawFrame4(OLEDDisplay *display, OLEDDisplayUiState* state, int16_t x, int16_t y) {
display->clear();
display->setFont(ArialMT_Plain_24);
display->setTextAlignment(TEXT_ALIGN_LEFT);
float h = dht.readHumidity();
display->drawString(0, 0,"Humidity");
display->drawString(0, 26, String(h)+"%");
delay(1000);
}
// this array keeps function pointers to all frames
// frames are the single views that slide from right to left
FrameCallback frames[] = { drawFrame1, drawFrame2, drawFrame3, drawFrame4};
int numberOfFrames = 4;
void setup()
{
// Initialise serial communication, set baud rate = 115200
Serial.begin(115200);
dht.begin();
// initialize dispaly
display.init();
display.clear();
display.display();
//display.flipScreenVertically();
display.setFont(ArialMT_Plain_10);
display.setTextAlignment(TEXT_ALIGN_CENTER);
display.setContrast(255);
// Connect to WiFi network
WiFi.begin(ssid, password);
int counter = 0;
// Wait for connection
while (WiFi.status() != WL_CONNECTED)
{
delay(500);
Serial.print(".");
display.clear();
display.drawString(64, 10, "Connecting to WiFi");
display.drawXbm(46, 30, 8, 8, counter % 3 == 0 ? activeSymbol : inactiveSymbol);
display.drawXbm(60, 30, 8, 8, counter % 3 == 1 ? activeSymbol : inactiveSymbol);
display.drawXbm(74, 30, 8, 8, counter % 3 == 2 ? activeSymbol : inactiveSymbol);
display.display();
counter++;
}
Serial.println("");
Serial.print("Connected to ");
Serial.println(ssid);
//Print IP to console
Serial.print("IP address: ");
Serial.println(WiFi.localIP());
delay(3);
// Start the server
server.begin();
Serial.println("HTTP server started");
ui.setTargetFPS(30);
// You can change this to
// TOP, LEFT, BOTTOM, RIGHT
ui.setIndicatorPosition(BOTTOM);
// Defines where the first frame is located in the bar.
ui.setIndicatorDirection(LEFT_RIGHT);
// You can change the transition that is used
// SLIDE_LEFT, SLIDE_RIGHT, SLIDE_TOP, SLIDE_DOWN
ui.setFrameAnimation(SLIDE_LEFT);
// Add frames
ui.setFrames(frames, numberOfFrames);
// Inital UI takes care of initalising the display too.
ui.init();
Serial.println("");
updateData(&display);
}//End of setup
void loop()
{
// Wait a few seconds between measurements.
delay(200);
dht.begin();
// Reading temperature or humidity takes about 250 milliseconds!
// Sensor readings may also be up to 2 seconds 'old' (its a very slow sensor)
float h = dht.readHumidity();
// Read temperature as Celsius (the default)
float t = dht.readTemperature();
// Read temperature as Fahrenheit (isFahrenheit = true)
float f = dht.readTemperature(true);
// Check if any reads failed and exit early (to try again).
if (isnan(h) || isnan(t) || isnan(f)) {
Serial.println(F("Failed to read from DHT sensor!"));
return;
}
delay(100);
WiFiClient client = server.available();
if (readyForUpdate && ui.getUiState()->frameState == FIXED) {
updateData(&display);
}
int remainingTimeBudget = ui.update();
if (remainingTimeBudget > 0) {
delay(remainingTimeBudget);
}
/////////////////////////////////////
// Read the first line of the request
/////////////////////////////////////
String sRequest = client.readStringUntil('\r');
client.flush();
// get path; end of path is either space or ?
// Syntax is e.g. GET /?show=1234 HTTP/1.1
String sPath="",sParam="", sCmd="";
String sGetstart="GET ";
int ifirst,isecond,ithirdt;
ifirst = sRequest.indexOf(sGetstart);
if (ifirst>=0)
{
ifirst+=+sGetstart.length();
isecond = sRequest.indexOf(" ",ifirst);
ithirdt = sRequest.indexOf("?",ifirst);
// are there parameters?
if(isecond>0)
{
if(ithirdt>0)
{
// there are parameters
sPath = sRequest.substring(ifirst,ithirdt);
sParam = sRequest.substring(ithirdt,isecond);
}
else
{
// NO parameters
sPath = sRequest.substring(ifirst,isecond);
}
}
}
String htmlContent ;
if(sPath=="/"){
htmlContent = ("HTTP/1.1 200 OK\r\nContent-Type: text/html\r\nConnection: close\r\n\r\n");
htmlContent += ("<html><head><style type=\"text/css\">\n");
htmlContent += ("<!DOCTYPE svg PUBLIC \"-//W3C//DTD SVG 1.1//EN\” \"http://www.w3.org/Graphics/SVG/1.1/DTD/svg11.dtd\">\n"); ////Need to be able to view on iOS devices
htmlContent += ("</style></head><body>\n");
htmlContent += ("<div style=\"float:center; width:900px; height: 900px;\">\n");
htmlContent += ("<h3 style=text-align:center;font-size:200%;>ESP8266, Google Gauge and OLED Display</h3>\n");
htmlContent += ("<h3 style=text-align:center;>Web Server Based DHT 11 Temperature and Humidity Monitor</h3>\n");
//include Jquery and graphing API
htmlContent += ("<script type='text/javascript' src='https://ajax.googleapis.com/ajax/libs/jquery/1.4.4/jquery.min.js'></script>\n");
htmlContent += ("<script type='text/javascript' src='https://www.google.com/jsapi'></script>\n");
htmlContent += ("<script type='text/javascript' src='https://www.gstatic.com/charts/loader.js'></script>\n");
htmlContent += ("<script type='text/javascript'>\n");
htmlContent += ("$.ajaxSetup ({\n");
htmlContent += ("// Disable caching of AJAX responses\n");
htmlContent += ("cache: false\n");
htmlContent += ("});\n");
htmlContent += ("var chartC;var chartF;var chartP;var dataC;var dataF;var dataP;google.load('visualization', '1', {packages:['gauge']});\n");
htmlContent += ("google.setOnLoadCallback(drawChart);\n");
client.print(htmlContent);
//Temp Celsius update
htmlContent = ("function displayDataC(cValue) {\n");
htmlContent += ("dataC.setValue(0, 0, '" + String((char)176) + "C');\r\n");//Char 176 is degrees symbol
htmlContent += ("dataC.setValue(0, 1, cValue);\n");
htmlContent += ("chartC.draw(dataC, optionsTempC);}\n");
//Temp Fahrenheit update
htmlContent += ("function displayDataF(fValue) {\n");
htmlContent += ("dataF.setValue(0, 0, '" + String((char)176) + "F');\r\n");//Char 176 is degrees symbol
htmlContent += ("dataF.setValue(0, 1, fValue);\n");
htmlContent += ("chartF.draw(dataF, optionsTempF)};\n");
//humidity update
htmlContent += ("function displayDataP(pValue) {\n");
htmlContent += ("dataP.setValue(0, 0, 'H %');\n");
htmlContent += ("dataP.setValue(0, 1, pValue);\n");
htmlContent += ("chartP.draw(dataP, optionshumidity);}\n");
//Get new reading using JSON
htmlContent += ("function loadData() {var c; var f;var p;\r\n");
htmlContent += ("$.getJSON('/data.json', function(data) {\r\n");
htmlContent += ("c = data.tempC;\r\n");
htmlContent += ("f = data.tempF;\r\n");
htmlContent += ("p = data.humidity;\r\n");
htmlContent += ("if(c){displayDataC(c);}\r\n");
htmlContent += ("if(f){displayDataF(f);}\r\n");
htmlContent += ("if(p){displayDataP(p);}\r\n");
htmlContent += ("});}\r\n");
//Create a new chart
htmlContent += ("function drawChart() {\n");
htmlContent += ("chartC = new google.visualization.Gauge(document.getElementById('chart_divC'));\n");
htmlContent += ("dataC = google.visualization.arrayToDataTable([['Label', 'Value'],['\260C', 80],]);\n");
htmlContent += ("chartF = new google.visualization.Gauge(document.getElementById('chart_divF')); \n");
htmlContent += ("dataF = google.visualization.arrayToDataTable([['Label', 'Value'],['\260F', 66],]);\n");
htmlContent += ("chartP = new google.visualization.Gauge(document.getElementById('chart_divP'));\n");
htmlContent += ("dataP = google.visualization.arrayToDataTable([['Label', 'Value'],['humidity', 1100],]);\n");
htmlContent += ("optionsTempC = {width: 300, height: 300, redFrom: 80, redTo: 100,yellowFrom:60, yellowTo: 80, greenFrom:30, greenTo: 60, majorTicks: ['0','10','20','30','40','50','60','70','80','90', '100'],minorTicks: 10,min: 0, max: 100};\n");
htmlContent += ("optionsTempF = {width: 300, height: 300, redFrom: 176, redTo: 212,yellowFrom:140, yellowTo: 176, greenFrom:86, greenTo: 140,majorTicks: ['32','50','68','86','104','122','140','158','176','194', '212'],minorTicks: 10,min: 32, max: 212};\n");
htmlContent += ("optionshumidity = {width: 300, height: 300, redFrom: 80, redTo: 100,yellowFrom:60, yellowTo: 80, greenFrom:0, greenTo: 60,majorTicks: ['0','10','20','30','40','50','60','70','80','90', '100'],minorTicks: 10,min: 0, max: 100};\n");
//Call loadData every second
htmlContent += ("loadData();setInterval(loadData," + String(GAUGE_REFRESH) + ");}</script>\n");
// htmlContent += ("<div style=\"clear:both;\"></div>\n");
htmlContent += ("<div id=\"chart_divC\" style=\"float:left; width:300px; height: 300px;\"></div>\n");
htmlContent += ("<div id=\"chart_divF\" style=\"float:left; width:300px; height: 300px;\"></div>\n");
htmlContent += ("<div id=\"chart_divP\" style=\"float:right; width:300px; height: 300px;\"></div>\n");
htmlContent += ("<div id=\"chart_divHIC\" style=\"float:left; width:300px; height: 300px;\"></div>\n");
htmlContent += ("<div id=\"chart_divHIF\" style=\"float:left; width:300px; height: 300px;\"></div>\n");
htmlContent += ("</body></html>\n");
//Send the data to the client
client.print(htmlContent);
}//End root
else if(sPath=="/data.json"){
htmlContent = ("HTTP/1.1 200 OK\r\nContent-Type: application/json\r\nConnection: close\r\n\r\n");
htmlContent += ("{\"tempC\":\"" + String(t) + "\",\"tempF\":\"" + String(f) + "\",\"humidity\":\"" + String(h) + "\"}");
client.print(htmlContent);
}
//// Serial.print("temperature: ");
//Serial.print(t,2);
//Serial.print(" deg C, ");
//Serial.print(f,2);
//Serial.print(" deg F ");
//Serial.print(h,2);
//Serial.print(" %, ");
}//End of main loop
After a successful upload, open the Serial Monitor at a baud rate of 152000. Press the “EN/RST” button on the ESP8266 board and see the IP address in serial monitor.

After that Open the web browser and enter the IP address path for temperature gauge display.

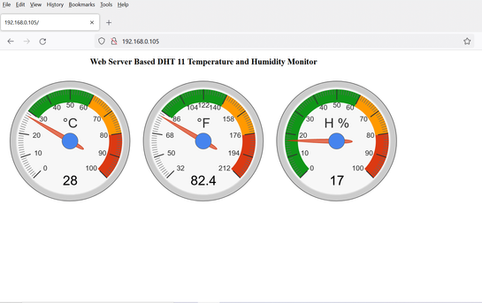


Demo:


Comments